Image classification can be used in a variety of applications. The Image Classification tool in ArcMap is used to convert imagery into a single band raster that can be used for land cover classification through further use of the Interactive Supervised Classification tool. Applications of land cover classification are useful in analyzing aerial ortho photography images to determine features, create layers, and are helpful in calculating the amount of area covered for various types of land cover analyses. Performing a simple Interactive Supervised Classification operation allows one to quickly identify and classify features found within an entire aerial image.These tools are valuable and easy to use in locating, classifying and identifying any type of land cover.
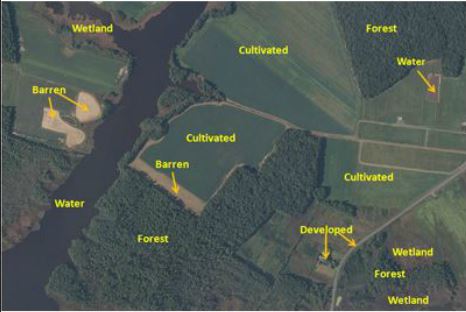
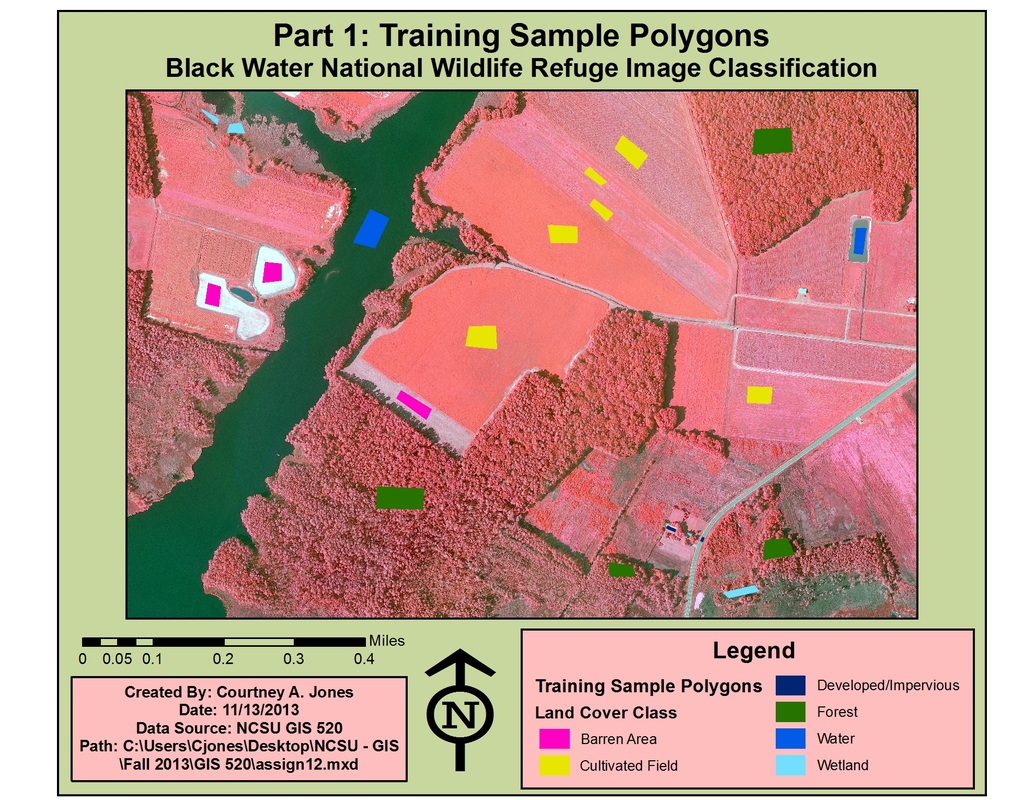
Image classification is used to simplify complex imagery (i.e. aerial orthophotos, satellite images, etc.) into discrete categories. One identifies areas for each land class category and ArcMap compares the pixel values of the user identified areas to the remainder of the image and results in a classified final image. In the example below, ArcMap was used to classify a four band aerial raster image of the Black Water National Wildlife Refuge, Maryland. The photo was a 4-band (R,G,B true-color and color-infrared) 1-foot resolution image flown in August of 2010.
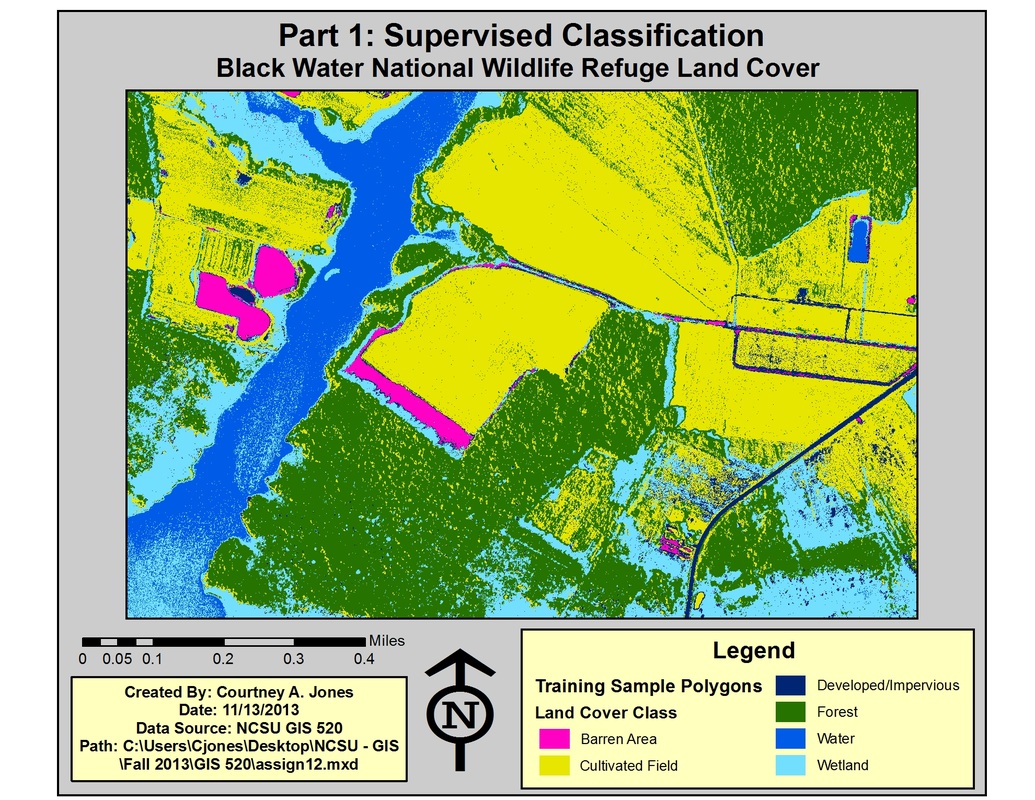
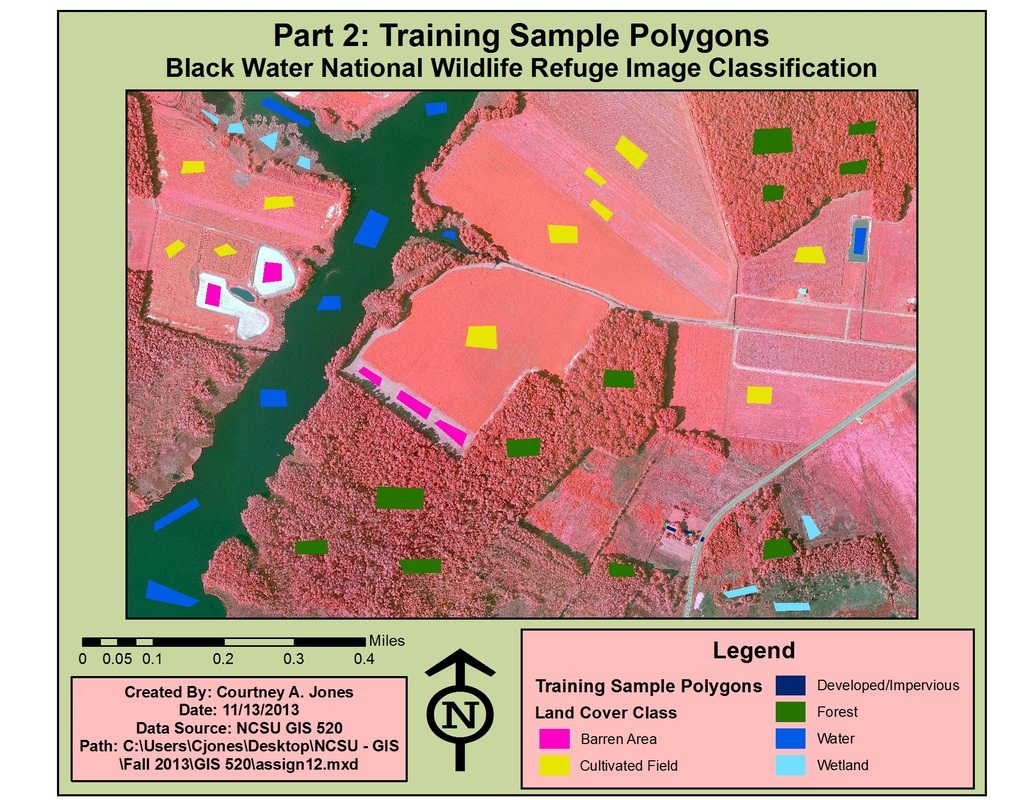
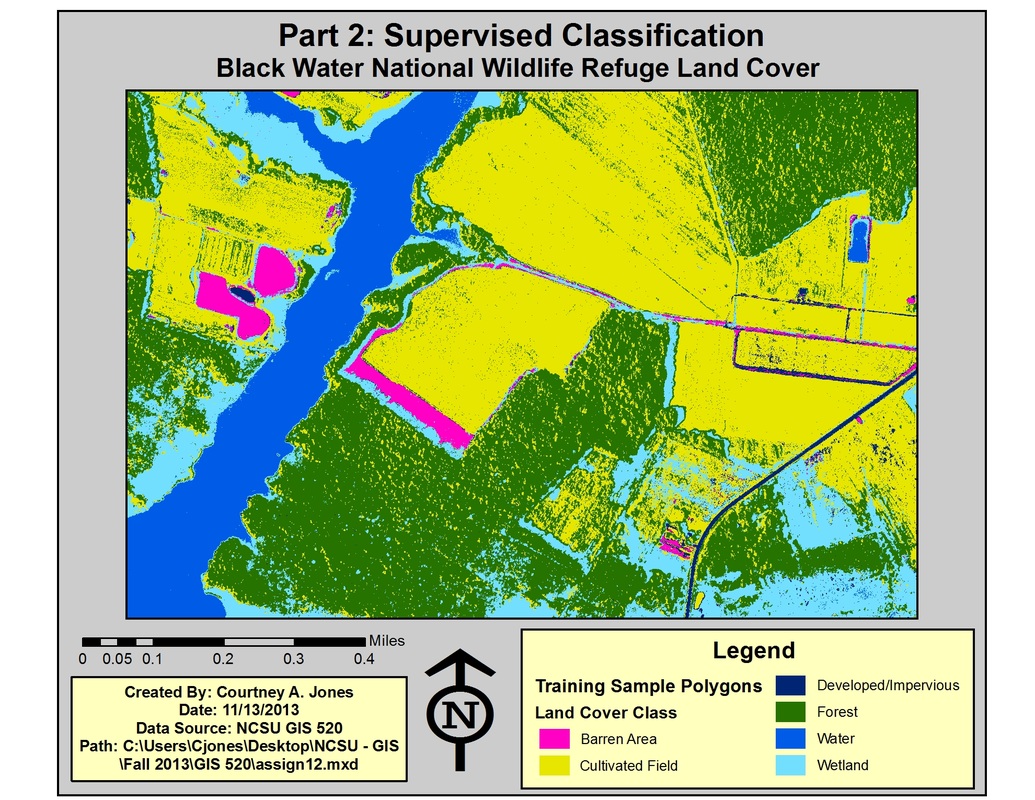
To successfully run a supervised classification on an aerial photograph one must determine the land classes of interest and identify the number of these "sample areas" in the photo prior to running the supervised classification tool in ArcMap. The Image Classification Toolbar can be found using the Customize menu and Image Classification Toolbar. First, a supervised classification is run using at least two training sample polygons per land cover (6 total). This process assigns a land cover type to each cell within the image. The classified output images may contain mis-classifications (errors). Analysis is used to determine improved classifications, appropriate areas for adding additional sample polygons and to visually compare outputs until the user is satisfied with the accuracy of the image classifications.
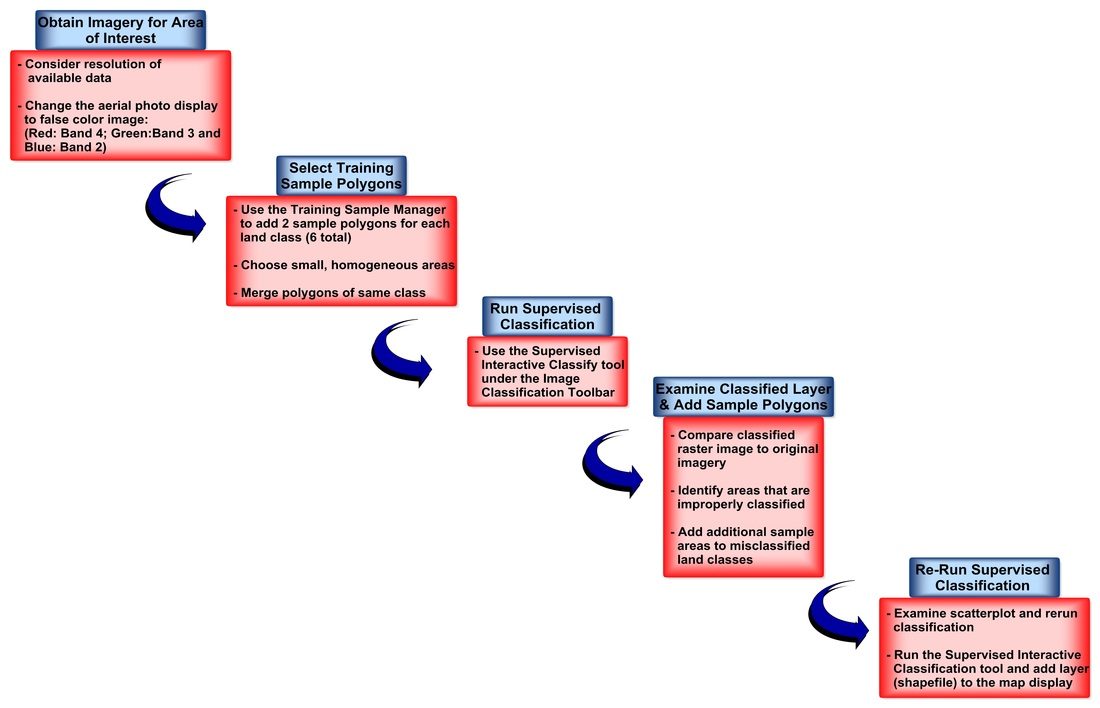
Figure 1. General workflow diagram for image classification procedure. Click on diagram for enlarged image