The Forth Worth, TX Fire Department is interested in analyzing its emergency calls data. The problem below used various spatial statistical methods to determine if emergency calls for the Fort Worth, TX Fire Department exhibited clustering and/or assesses various levels of clustering. Spatial statistical tools that increased the level of confidence that the distribution of features is not occurring due to random chance were used. To complete the objective, it is essential to understand the spatial analysis tools that are used to study patterns and determine what the probability that the distribution of features is occurring due to random chance. A variety of tools will be used in ArcMap to illustrate spatial statistics analysis using four (4) specific models. First, one should identify where the Fort Worth Fire Department, Battalion 2 receives false alarms for February 2007. The visual display will assist in establishing target areas for safety campaigns explaining how to recognize emergencies and how to avoid false alarms. After visually evaluating one's data, spatial statistics can be used to identify and quantify spatial patterns and relationships, such as clustering within the data. While spatial statistical methods account for spatial characteristics, they may also use hypothesis testing similar to traditional statistical methods.
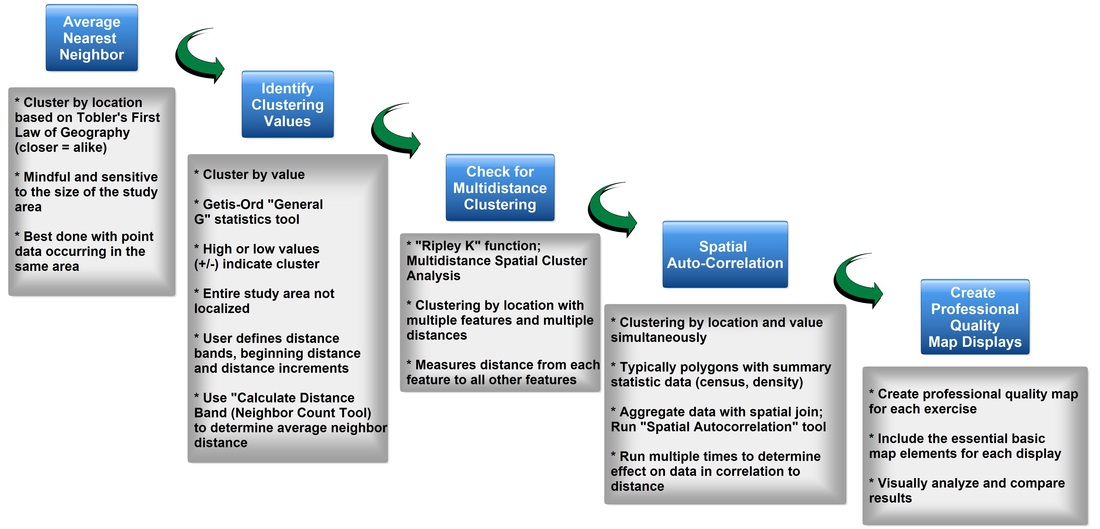
Figure 1. Spatial statistics workflow diagram for techniques used to evaluate clustering. Click on diagram for an enlarged image.
The four tools explained below evaluated whether the location of point features can be explained by a random chance.
The Average Nearest Neighbor Tool will be used to determine if clustering exists based on distance to nearest neighbor. The average nearest neighbor tool calculates an index based on how close features are located and compares that distance to an index for randomly distributed features. This assesses clustering based on location alone. The tool is used by inputting the feature class of interest and setting the area to a size similar to the dataset. A nearest neighbor ratio, z-score and p-value are outputs.
The Average Nearest Neighbor Tool will be used to determine if clustering exists based on distance to nearest neighbor. The average nearest neighbor tool calculates an index based on how close features are located and compares that distance to an index for randomly distributed features. This assesses clustering based on location alone. The tool is used by inputting the feature class of interest and setting the area to a size similar to the dataset. A nearest neighbor ratio, z-score and p-value are outputs.
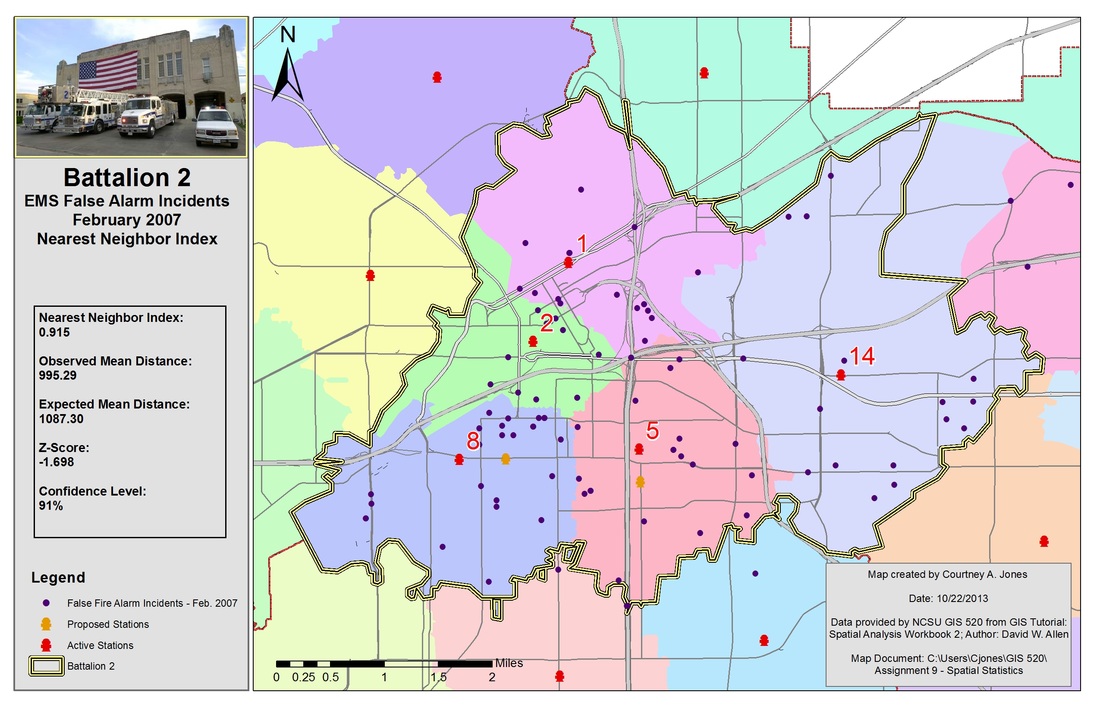
Results of using the nearest neighbor methods to calculate an index and z-score to determine clustering.
Next, areas will be identified where the Fort Worth Fire Department, Battalion 2 received services calls in January 2007 to determine if clustering occurred. The map will used Getis-Ord General G to calculate z-score if high or low values cluster by conducting analysis for various distances to determine maximum z-score. The Getis-Ord General G tool examines clustering based on value. The tool determines whether areas of similar values are more clustered than would be expected in a random distribution. To use this tool, the dataset must be examined for the approximate number of neighbors and the distance band. This assists in determining the distance range to use. The feature class and field of interest are inputs and the tool results in a G index, z-score and p-value.
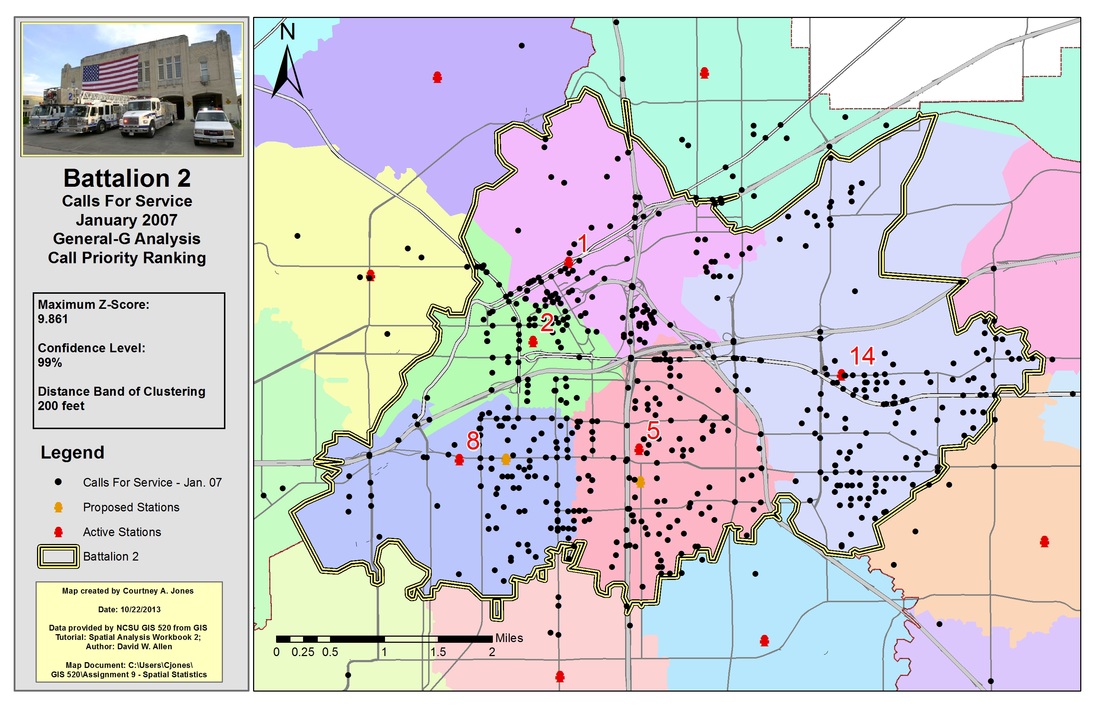
Results of using the Getis-Ord General G tool to calculate a z-score to assess whether the features were clustered.
Then, areas where the Fort Worth Fire Department received service calls for January 2007 are identified to determine if clustering occurred when all neighbors were accounted for. The map uses a multi-distance clutering tool known as Ripley's K Function to run a large number of scenarios to provide a basis for comparing the levels of clustering and determining the most significant areas. The Ripley's K Function is similar to the nearest neighbor calculation, but can also examine multiple distances and factors other than the next nearest feature. This tool requires the layer of interest, number of distance bands and the number of confidence envelopes that should be used. The confidence envelope is a variation of the random distribution used for comparison.
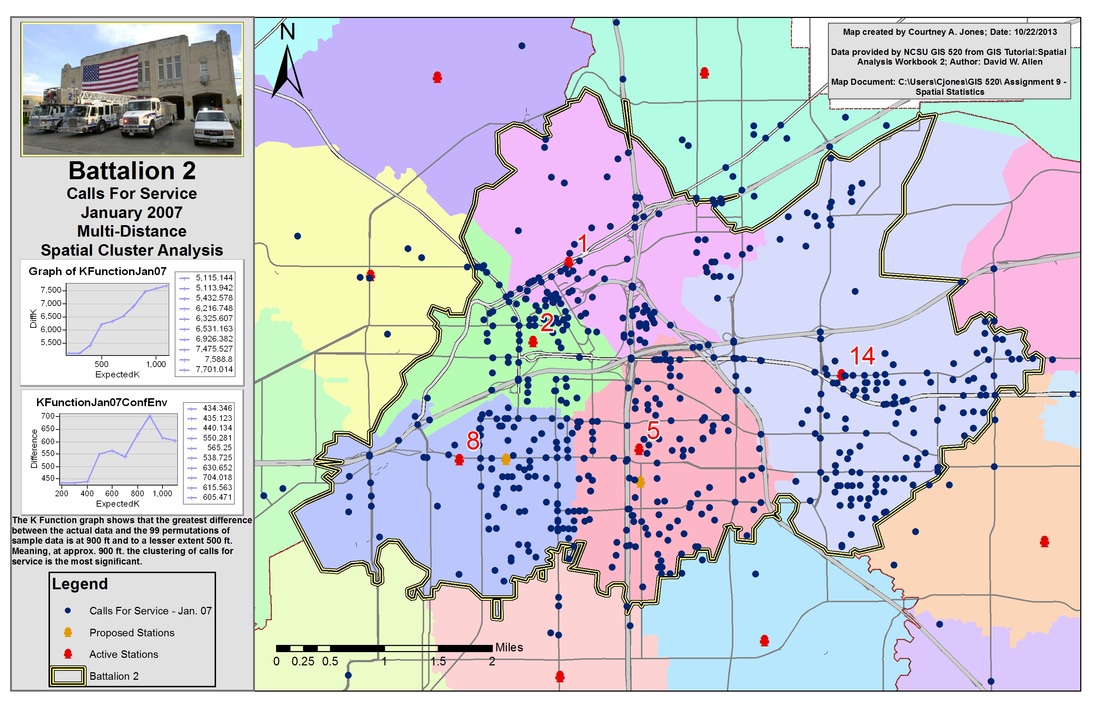
Results of using the multi-distance spatial cluster analysis tool, Ripley's K Function, to assess the significance of clustering.
Lastly, the density of calls per block is identified to determine what distance densities cluster. The map will use the spatial autocorrelation tool known as Moran's I Function to identify if clustering is occurring in a clustered, random or dispersed manner using distances from 250-600 feet in increments of 50 feet. Moran's I combines evaluation of clustering by location and value. This tool requires a layer and field of interest, but also requires that a grid cell size be used. The grid cells should be large enough that all have at least one data point, but are small enough to display a range of values. The tool results in a z-score and p-value.
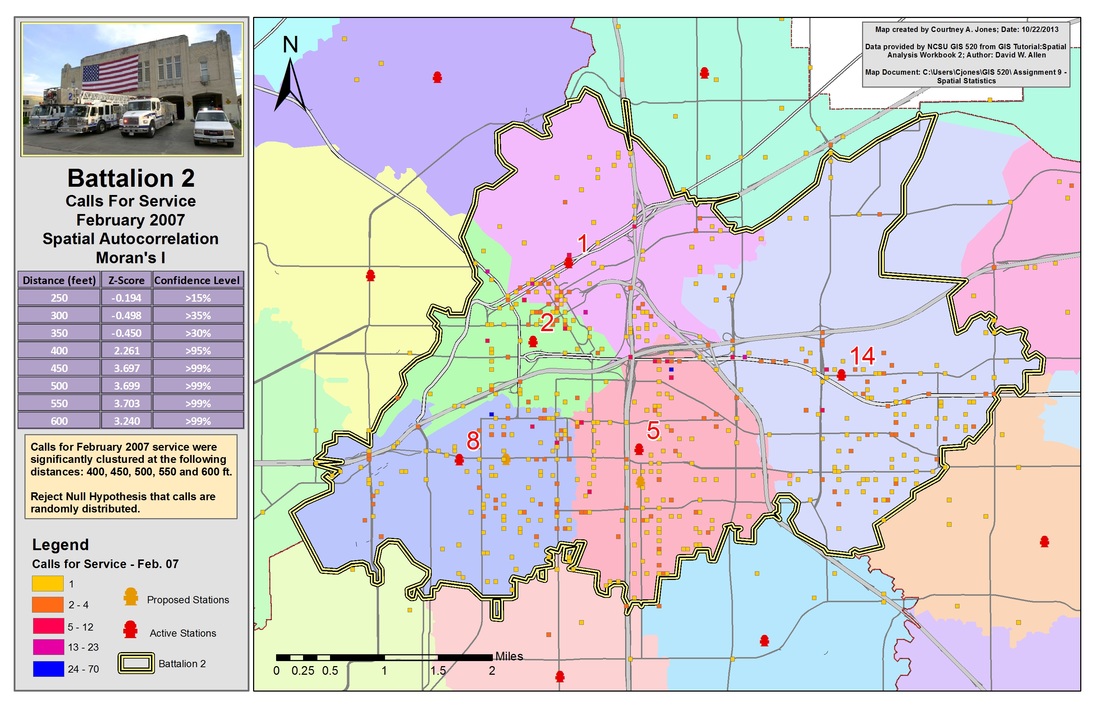
Results of using the spatial auto correlation tool, Global Moran's I, to determine z-scores and confidence levels assessing the level of clustering at varying distances.
Since Average Nearest Neighbor identifies if physical locations are closer together than they would be expected within a random distribution, the tool could be utilized for determining incidents near areas of interests and determining if a correlation exists between variables.
Since Getis-Ord General G (high/low clustering) tool can be applied to determine clustering, areas of specific activity and congregation can be analyzed near user defined demographic areas to determine demographic impact on activities.
Since Ripley’s K function (Multi-Distance Spatial Cluster Analysis) calculates cluster based on all locations, this tool could be used to identify areas of high and low concentrations such as hot spots analysis and density mapping.
Since Spatial Auto Correlation and Moran’s I calculates cluster based on both location and value, this tool could be used to identify the ideal areas that users may be interested in within their field of research based on data values.
