Problem
"Due to the black-out of the northeastern United States on August 14, 2003 and Homeland Security issues, the Federal government is investigating possible locations for new high power transmission lines to increase the stability of the United States power grid. The New Riber Gorge National River is being investigated as one possible location. As part of the investigation, the effects of a new power transmission line corridor within the park boundary must be assessed. The resulting environmental impact statement must address both the natural and cultural resources managed by the park."
I was tasked with creating a web map that:
- Displayed the habitat characteristics of vertebrate monitoring sites;
- Displayed the cultural significance of buildings;
- Displayed the attributes of individual vertebrate observations (by species) and ensured that the observation is uniquely identifiable from other observations at the same data point;
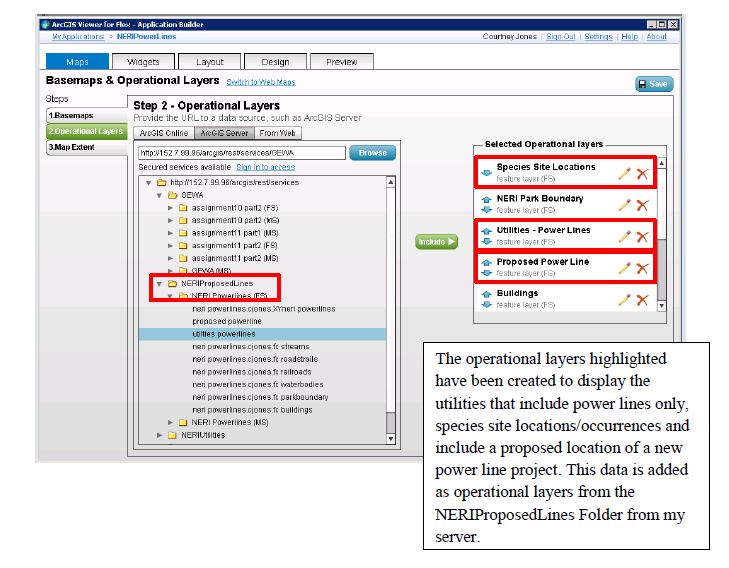
- Display only the power lines in the utilities data layer;
- Allow user to propose location of a new power line project, assign attributes and save to a database;
- Allow user to create a buffer around the proposed power line to determine vertebrate monitoring sites and buildings affected
Analysis
1. Create a relationship model and tables in Microsoft Access from the data (tables and shapefiles provided).
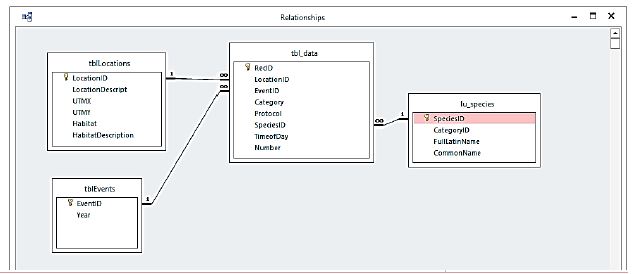
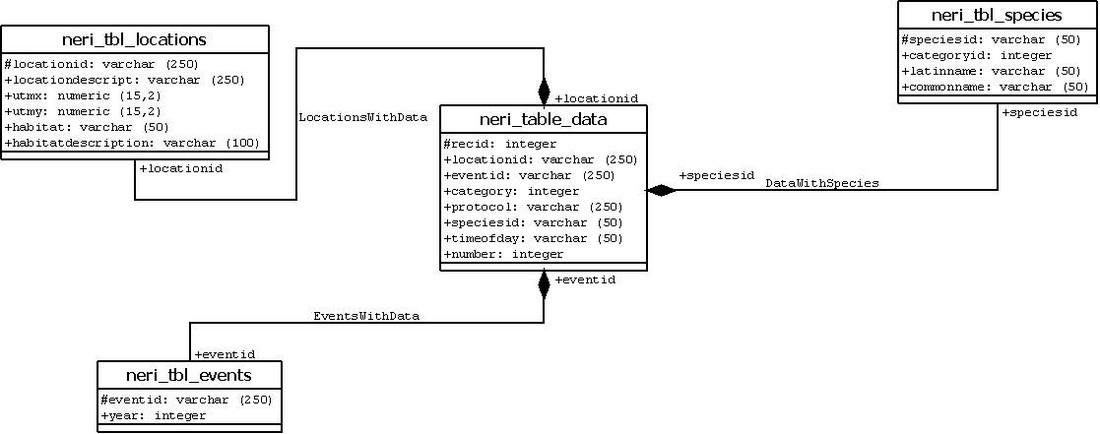
2. The next step was creating a UML diagram using DIA to appropriately display relationships and associations between data tables. DIA allows a user to edit new classes, table names and fields. It also displays and identifies primary (#) and foreign keys as well as types of relationships between data associations.
3. Next, I created an ArcSDE Database and a new connection in ArcCatalog, uploaded and created new tables in the ArcSDE Database and PgAdminIII and added spatial data to the database and in ArcCatalog.
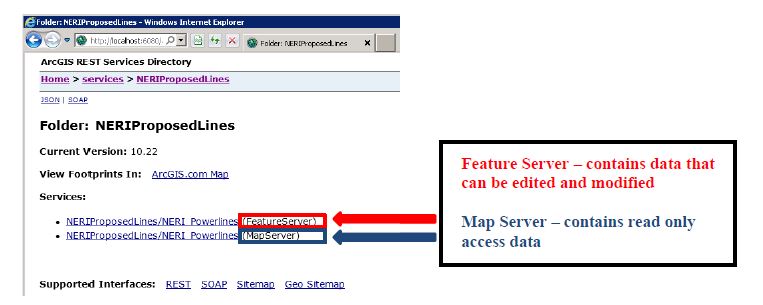
4. An .mxd map was created in ArcMap Desktop, edited and published as services.
5. Next, a map in ArcGIS Viewer for Flex Application Builder was created.
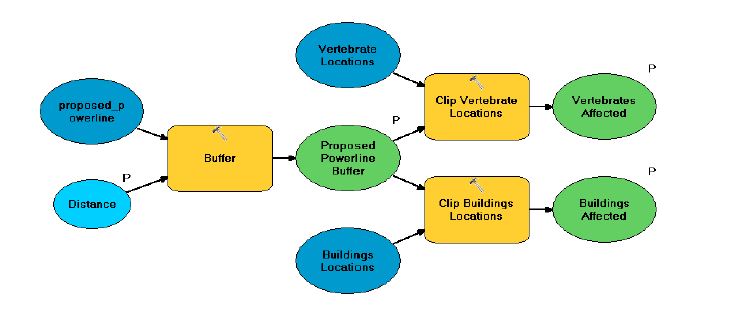
6. A geoprocessing web application was configured. To publish a Geoprocessing service a Model Builder is necessary. This particular model was created in ArcCatalog to identify vertebrate sampling sites and buildings within the proposed powerlines buffer area. Input and output model parameters are labeled accordingly.
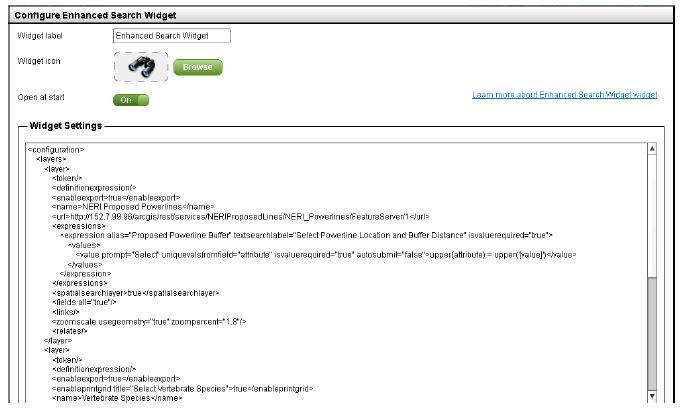
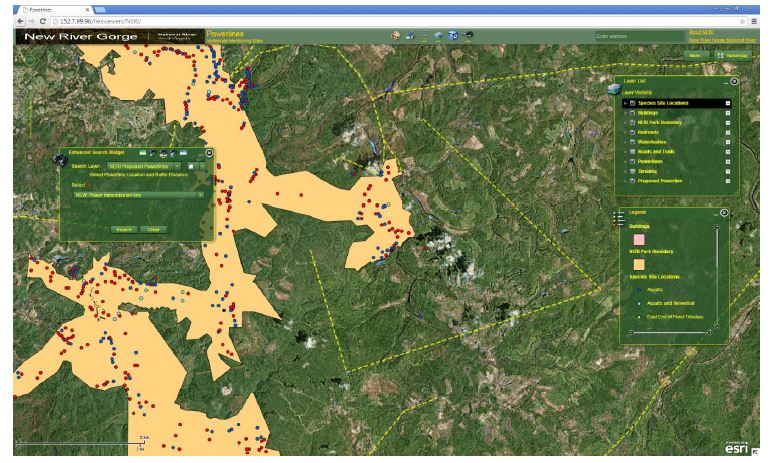
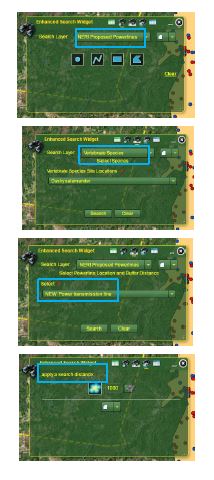
7. Enhanced Search Widget Configuration: The geoprocessing task at hand was to use the Enhanced Search Widget to identify the vertebrate sampling sites and buildings within a buffered area within NERI.
Final Web Mapping Application
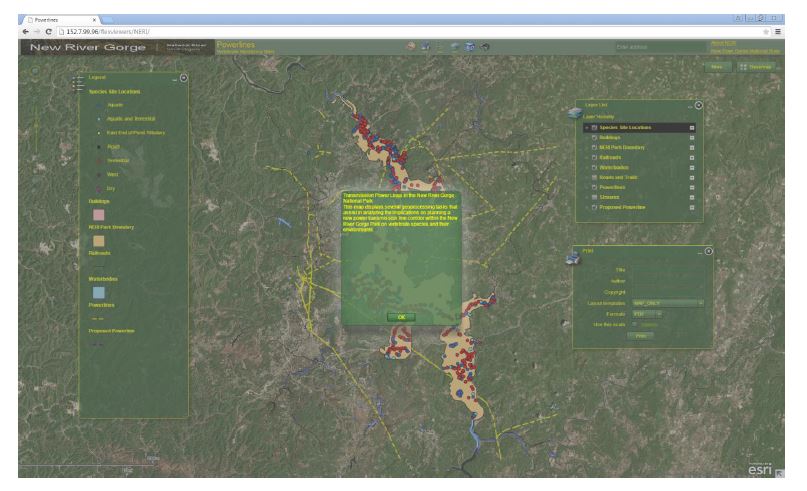
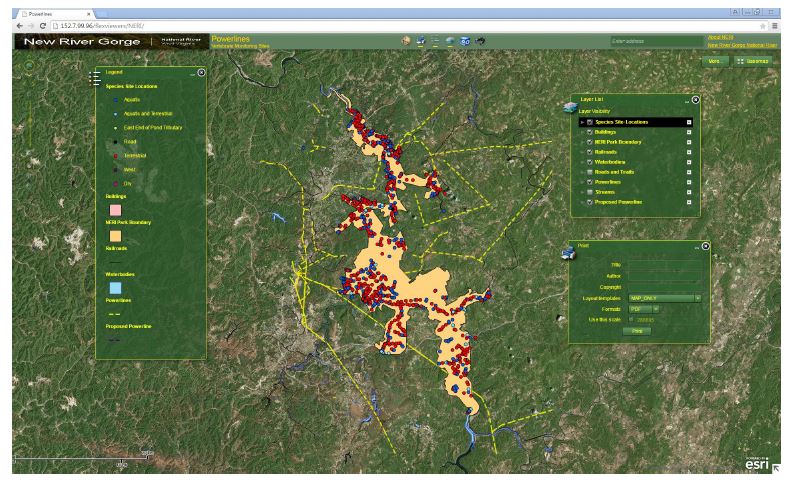
The final mapping application was created in Viewer for Flex. The initial screen below displays the map with an interactive NERI layer list, legend and print widget. The application is also displayed using two basemap options (topography and streets). Also below are captures of the application initially, task dialog boxes, drop-down options, query/user input options and results for the Geoprocessing and Enhanced Search widgets configured within.
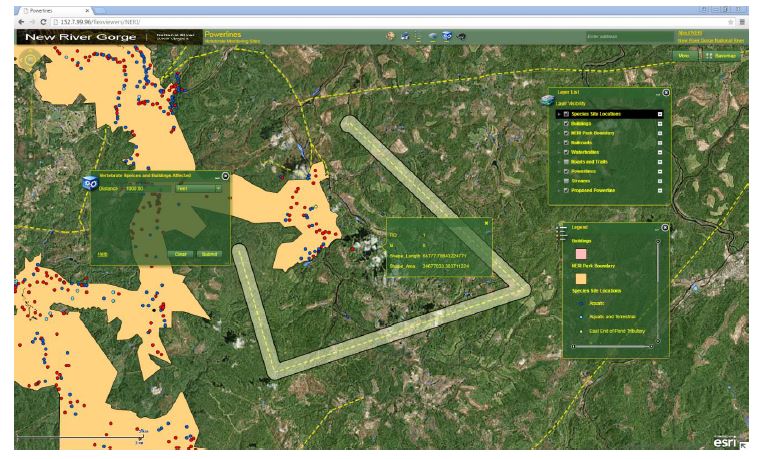
Results
Viewer for Flex provides the user with multiple options for useful widgets to be used when creating a web mapping application. All widgets are helpful and serve a specific purpose to the user when creating an application. To complete geoprocessing tasks one should use either the Geoprocessing or Enhanced Search widget (both can be used if necessary).
